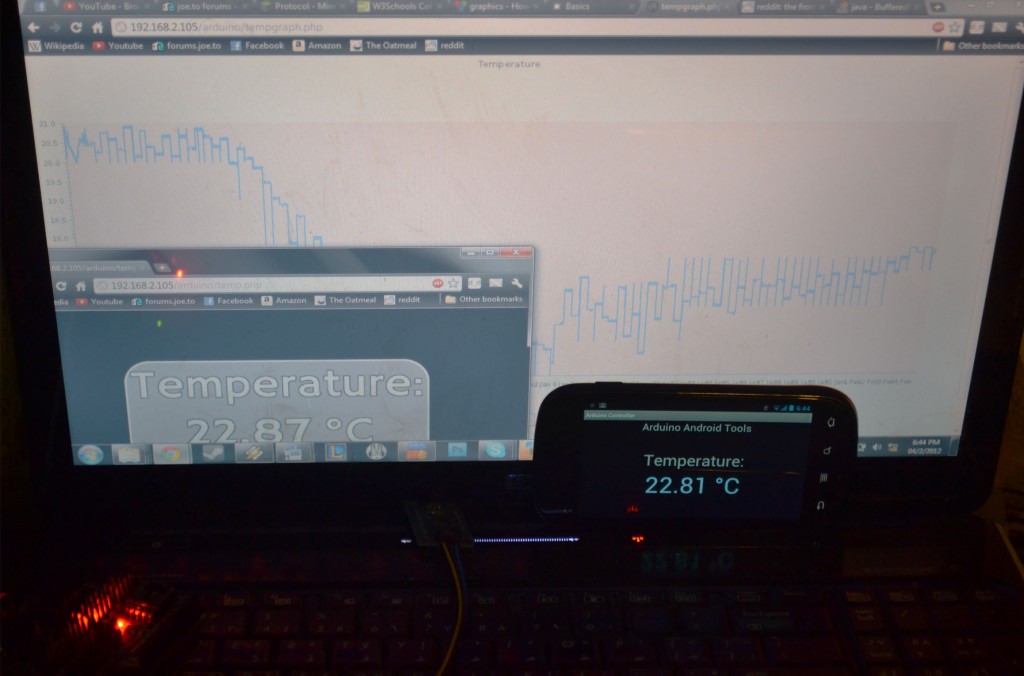
I was always really interested in making new projects for my arduino, the first of which was an LED music visualizer. The problem here was that arduinos aren't really popular in Pakistan, I had to get my current duemillenove shipped in from China thus getting an internet shield would be very difficult. One fine day I started thinking and said to myself, hey I nave a dedicated home server why not just hook up the arduino to that and write a program on the server to read that data through serial and use it somehow. Initially it was designed just to be able to read the current temperature, graphing was added in later. Here is how it works: The first part of the process is an arduino which has a DS18B20 Temperature Sensor attatched to it. Using serial communication, it sends out temperature readings to my dedicated home server. The next part is a python script running in an infinite loop, it reads the values from the serial port and then proceeds to put them in a MySQL table, this occurs once every 2 minutes.
import MySQLdb
import time
import serial
import sys

conn = MySQLdb.connect (host = "localhost",
 user = "derp",
 passwd = "murp",
 db = "tempdata")

while True:
 timestamp = int(time.time())
 ser = serial.Serial('/dev/ttyUSB0');
 ser.open
 linebeep = ser.readline()
 line = ser.readline()
 cursor = conn.cursor()
 cursor.execute("""INSERT INTO Data(Temperature, Time)
 VALUES(%s, %s)""", (line, timestamp,))
 ser.close
 print timestamp
 print line
time.sleep(120)<?php
require_once ('jpgraph/src/jpgraph.php');
require_once ('jpgraph/src/jpgraph_line.php');
$link = mysql_connect('localhost', 'derp', 'hurp');
if (!$link) {
die('Could not connect: ' . mysql_error());
}
mysql_select_db("tempdata", $link);
$query = mysql_query("SELECT Temperature from Data");
$i = 0;
while($row = mysql_fetch_array($query)){
$holder = (float) $row[0];
$temparray[$i] = $holder;
$i++;
}
$query2 = mysql_query("SELECT Time from Data");
$p = 0;
//This part of the script is used to get the dates at the bottom
while($row = mysql_fetch_array($query2)){
$rowint = (int) $row[0];
$kitteh = date("G:i",$rowint);
if($kitteh == "0:01" || $kitteh == "0:02" || $kitteh == "0:00" || $kitteh == "0:03"){
$datesarray[$p]= date("j M", $rowint);
}
else{
$datesarray[$p] = "";
}
$p++;
}
$graph = new Graph(1300,700);
$graph->SetScale("textlin");
$theme_class=new UniversalTheme;
$graph->SetTheme($theme_class);
$graph->title->Set('Temperature');
$graph->SetBox(false);
$graph->img->SetAntiAliasing();
$graph->yaxis->HideZeroLabel();
$graph->yaxis->HideLine(false);
$graph->yaxis->HideTicks(false,false);
$graph->xgrid->Show();
$graph->xgrid->SetLineStyle("solid");
$graph->xaxis->SetTickLabels($datesarray);
$graph->xgrid->SetColor('#E3E3E3');
// Create the first line
$p1 = new LinePlot($temparray);
//$p1 = new LinePlot($newx);
$graph->Add($p1);
$p1->SetColor("#6495ED");
$p1->SetLegend('Temperature');
$graph->legend->SetFrameWeight(1);
// Output line
$graph->Stroke();
?>